What is Latency and when is it Considered Excessive?
Latency is a measure of how long it takes for specific types of exchanges to fully complete across the SAN. It is most accurately measured using the Exchange Completion Time (ECT) metric within VirtualWisdom. Excessive Latency is when the time to complete I/O operations across the SAN fails to meet design goals and impacts application performance.
Why is Excessive Latency a Problem?
Excessive Latency can be a sign of performance issues which need to be addressed before they cause applications to become unusable or lead to network outages.
What are Common Causes of Excessive Latency?
It is important to distinguish between two key potential contributors to Excessive Latency: those caused by performance issues within the storage array and those caused by issues in the SAN Fabric.
Excessive Latency within the Storage Array can often be caused by:
*Inappropriate configuration which doesn’t meet application requirements (wrong RAID type, use of high capacity capacity/low performance drives for transactional workloads, incorrect cache configuration etc.)
- A change in workload from that originally designed for
- Conflicting applications sharing the same disk groups
- Background tasks which impact primary response times, such as synchronous replication
Excessive Latency in the SAN Fabric can often be caused by:
- Exchanges terminated by Aborts (due to discarded packets or physical layer errors)
- Cancelled Transactions (due to SCSI or Fibre Channel Link Events)
- Switches dropping large numbers of packets (Class 3 Discards), primarily due to congestion
- Large numbers of physical layer errors (such as CRC Error, Frame Errors and Encoding Errors) and timeouts due to a variety of reasons including poor-quality connectivity
- Devices with incorrectly-set Queue Depth
- Slow-draining devices (devices requesting more information than they can consume)
- Buffer-to-Buffer Credits issues
- Unbalanced loads on storage arrays or ISLs
- Configuration issues (by design or by error)
- Delays introduced by the number of hops, transaction sizes and device incompatibility
- Other possible issues with servers, HBAs and switches
How to Spot Excessive Latency
SAN performance is often misunderstood and the term is applied to many different measurements and methods. In many cases it is only thought of in terms of a MB/sec or IOPS measurement. To really understand what is going on beneath the surface, it is very important to measure how long each exchange takes to complete. The Live Reports below show both Read and Write Exchange Completion times. The worst Read ECT in the environment is 102ms. The worst Write ECT is 7.5ms.
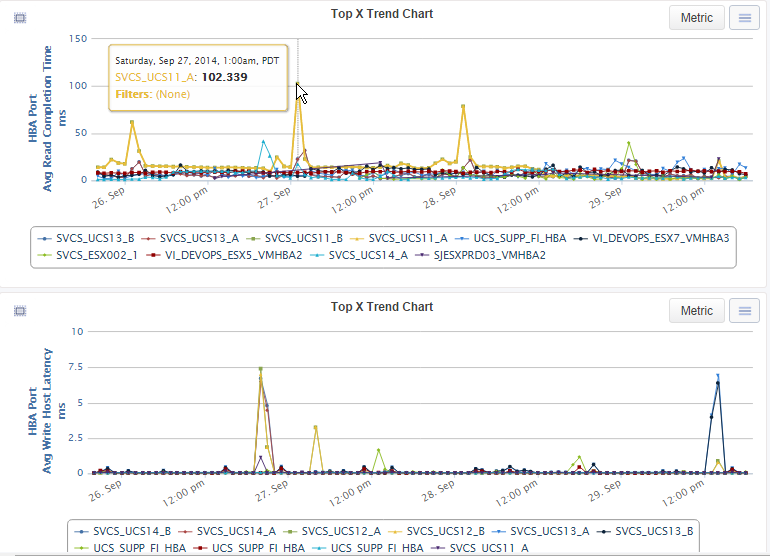
By knowing the minimum, maximum and average Exchange Completion Times for every device communicating on the SAN, a true picture of performance can be seen. VirtualWisdom, coupled with the SAN Performance Probe hardware, can track Read, Write and Other Exchange Completion Times.
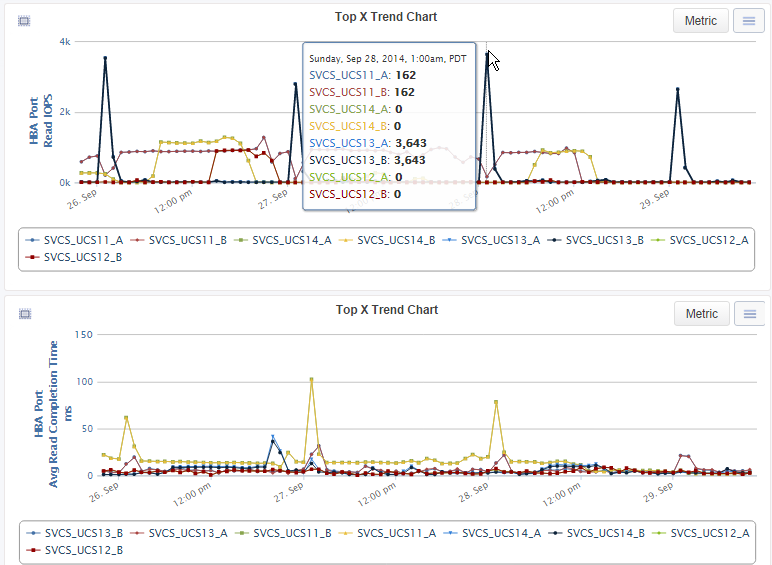
A very powerful feature of VirtualWisdom is to be able to track changes in transaction latency over time and visualize trends. The Live Reports allow correlation of trends and events with changes in the environment. Thus if an increasing load is causing an upward trend in latency and changes to back-end storage configuration are made, the impact on transaction latency can immediately be assessed. Alternatively, if a change in configuration is made, such as adding a new server onto an array, the impact of this change on existing applications can be measured, with clear graphical views showing the impact.
Latency spikes every once in a while on a SAN can be normal events. Prolonged periods of high latency however, indicate an issue which needs to be addressed. Applications typically fall into three broad categories: transaction-based high-latency-sensitive, transaction-based moderate-latency-sensitive and batch-based. For all three categories the maximum response time will often be in the 1000-3000ms range, even on a healthy SAN. When maximum times start to exceed these values however, there is typically a problem. Because of the extreme latency difference between the typical average and the typical maximum values, occasional outliers can occur without impacting the application if they happen during low-I/O periods (preventing the typical maximum from being averaged with many other transactions as it normally would).
If Exchange Completion Times of 30 seconds are seen, this will indicate that a SCSI command has failed due to a timeout (30 seconds is the typical timeout value seen on many host operating systems) and further investigation should be undertaken as to the reason.
The biggest difference between the three categories is for acceptable average response times over a one-minute time period (excluding low-load outliers). For some high-latency-sensitive applications, the ideal response time is in the 4-7ms range. For most applications, the response times should remain below 20-40ms as a high-end average.
For batch-based activities such as backups, MB/s or IOPS is often the best measurement to consider since this affects how long the overall activity takes. For these applications though, the Exchange Completion Times and the throughput times are often directly linked.
By viewing a summary of the key SAN metrics, we can take a holistic view of a mission-critical application. Here, the application has suffered a slowdown in Exchange Completion Times. While it may not yet have reached the point where the application team complains, this insight allows the SAN team to proactively hunt down the contributing factors.
Correlating Excessive Latency with Other Events
Excessive Latency in the presence of a large number of Class 3 Discards may be caused by a slow-draining device, Buffer-to-Buffer Credits issues, incorrectly-set Queue Depth or unbalanced loads. If many physical layer errors are occurring at the same time, the underlying problem may actually be a cabling or SFP issue. Any of these conditions may also eventually trigger Aborts. Buffer-to-buffer credit symptoms usually include both Excessive Latency and large numbers of exchanges which remain pending.
Change requests should also be reviewed, to identify conditions or events which are not related to those requests.
When exchanges are taking longer than normal to complete, it is important to consider how many commands are outstanding, how quickly the storage array is responding to each request and how the exchange times relate to the demand in the environment. The “Performance ECT and Demand” Live Report shows the relationship between demand for a specific Device and performance. If high latency is detected but there appears to be no correlation to demand, the “Performance and Queue” Live Reports should be run to check for a correlation with Queue Depth settings or Pending Exchanges.
One important metric which should be reviewed in conjunction with Exchange Completion Time is Command to First Data or Read Array Latency. This is the amount of time taken between the VirtualWisdom probe recording the SCSI Initiator Read command and the first data being seen from the array. This can be thought of as the array “thinking time.”
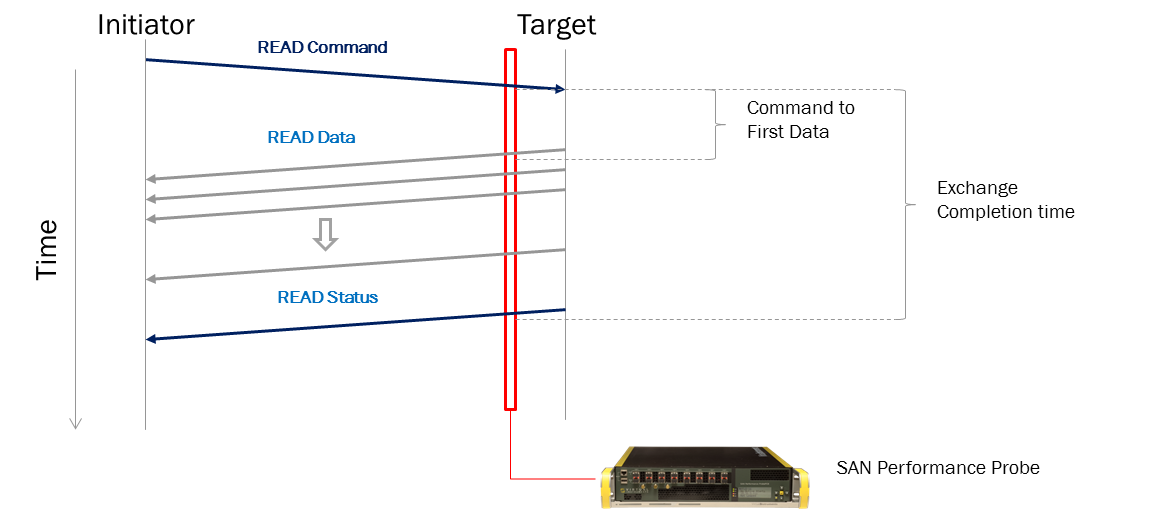
Most of the time, the Read Array Latency will be a few microseconds less than the entire ECT. If it is a high percentage compared to the overall ECT then there is most likely an array-based performance issue. This means that the majority of the entire exchange is spent waiting for data to be delivered by the array. This could be a cache miss, busy controller, background replication process or similar issue. Conversely, if the Read Array Latency time is very small compared to the overall ECT, the issue is most likely to reside in the SAN (congestion or a physical layer issue) or with the Initiator (slow-draining device).
VirtualWisdom Analytics can be used to correlate and identify the root cause for excessive latency. Please go to Event Advisor to see example of potential steps for locating a slow draining device.
How to Resolve Excessive Latency
To resolve latency issues, it is important to consider how many commands are outstanding, how quickly the storage array is responding to each request, how the exchange times relate to the demand in the environment and whether recent change requests could be contributing to the problem. Remediation may include re-configuration, re-routing or replacing equipment, depending upon the underlying cause.
Step 1: Identify Demand
The quickest way to identify and understand the performance is to look at the response times. Live Reports showing “Performance and Demand” can be used to find any latency in the environment, as well as to determine the relationship between the demand for the specific devices and the performance.
Step 2: Check Queue Depth and Pending Exchanges
If high latency is detected in Step 1 but there appears to be no correlation to demand, the a Live Report showing “Performance and Pending Exchanges ” could be run to determine if there is a correlation between the response times and the Queue Depth settings or Pending Exchanges. See the section on Queue Depth for more detail.
Step 3: Examine Performance at the Initiator Level
Performance should also be configured and understood at the Server and Storage level. This is typically the closest match to the values that Server teams are seeing and using to evaluate SAN health. It is also typically the best level to use when setting alert thresholds.
It is often important to separate and categorize the performance by the size of the transactions, the types of devices in the environment, and any tiering or other big differences in expected performance. Reporting and understanding the performance at these different levels can be critical to the successful remediation of latency problems.
VirtualWisdom has the capability to profile IO Performance for an Application, Server, Storage or other devices. The Histogram Live Report below shows an example of an IO profile for the SVCS Cluster 2 Application.
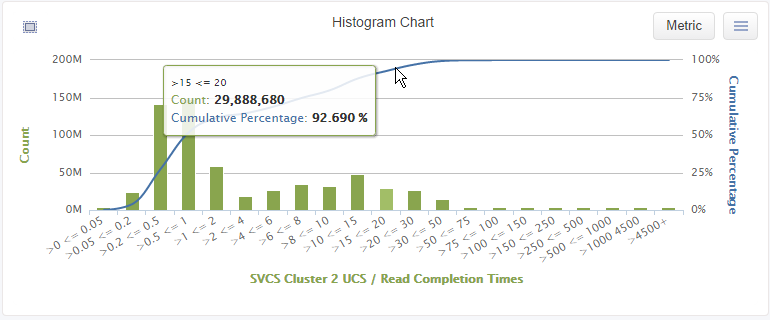
It shows that 92% of all Read Exchanges complete in less than 20ms. The VirtualWisdom Histogram capability is unique in the market place. It enables data center owners to understand the true distribution of IO performance.
Armed with all the Performance information provided by VirtualWisdom, proactive measures can be implemented to detect deviations from SLAs or Baseline values. Alarms based on such knowledge should be implemented.