What is IO Size?
IO Size is also commonly referred as block size. IO Request Size is the size of request that application uses to perform I/O operation on storage device. Every application uses a different I/O request size and based on how big the request size is, it can have pretty good impact on storage performance.
Understanding IO Profile
Storage array performance is measured in IOPS and/or Throughput. The size of I/O request impact both of these number. Higher the I/O size, bigger the throughput will be. On the reverse size, IOPS will be lower whereas if the I/O size is smaller you will get higher IOPS.
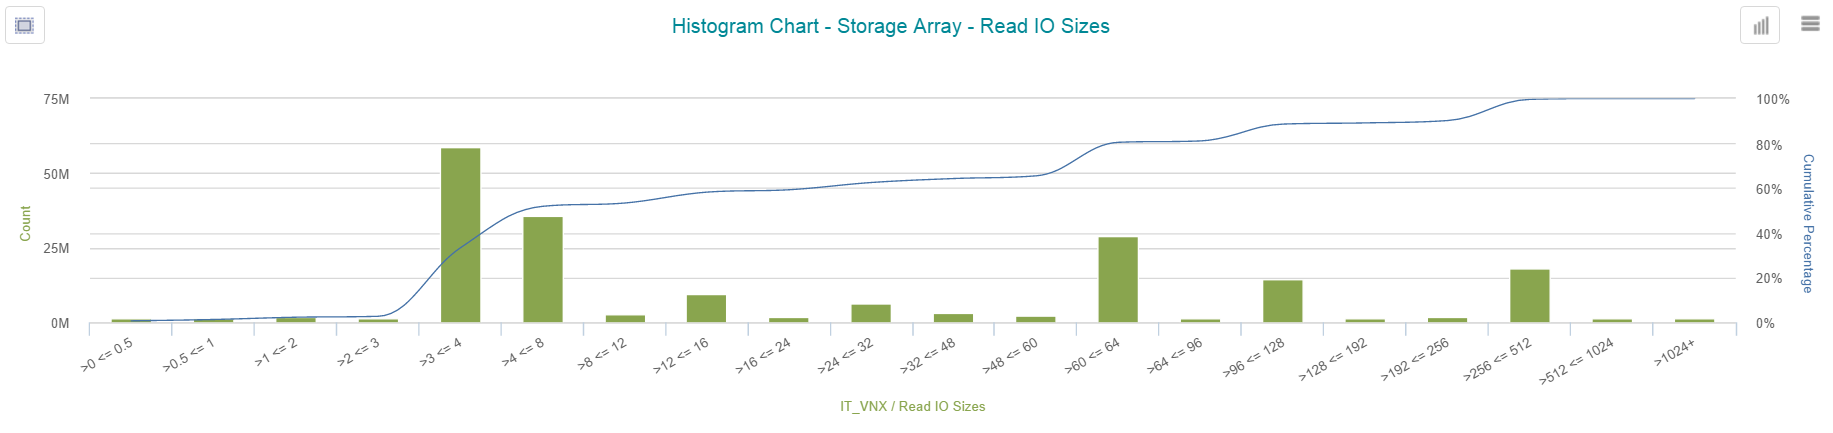
Using VW, you can get histogram chart for Read and Write IO Size for a specific entity (i.e. storage array, application, host, etc.).

Understanding how many IO requests the applications/hosts are sending to the storage array allows IT organization to architect a properly sized solution.
Balance between throughput and performance.
IO Size is the size of a single disk request. This is the parameter that can prove that “bigger is not always better”. You can find many recommendations online that increasing the IO Size is the best thing you can do to improve the throughput for your application… It can be true, if throughput is the only thing you care about. But what about performance? In fact, in some cases, big IO size can do more harm than good to overall performance.
Small vs Big
A lot of Small requests, when you need to send/receive a lot of sequential data is very inefficient. They can consume a lot of resources on your server and the array. But if you need only 4KB at a time, then this is the only way to go. Big requests, on the other hand, can provide some relief on the host. However, they usually put a heavy burden on other components of your SAN infrastructure.
Let’s take a typical application server. Usually, most of the disk traffic consists of rather small, random requests (except for backups, etc.). Small IOs are being completed much faster because:
- it has be divided in to less FC frames (a full FC data payload frame is 2KB)
- the array has to free up less chunks of cache to fulfill the request
- fetch time from disk is faster
Size vs other factors
IO size can impact your environment in many different ways. For example, impact of tuning this parameter can be different for a workload that is using one LUN versus one for a big server that is using hundreds of LUNs. Also the Queue Depth setting is very important. High QD setting combined with Big IO Size can in some situations bring the environment to its knees.
Few examples:
- Server has 2 HBAs zoned to 2 storage ports, 2 LUNs, QD of 16, with a consistent IO size of 64k. During its heaviest workload, it can only request 4MB of data at a time (2 paths x 2 luns x 16 queue depth per path x 64KB). Basically any storage should fulfill this demand with a constant very good performance.
- Server has 4 HBAs zoned to 4 storage ports, 48 LUNs, QD of 32 and consistent IO Size of 512 KB. Now, during heavy workloads, it could potentially ask for 3 GB of data at any given time! This amount of cache would be basically blocked by this one host at any given time while the job is running. If you request so much data at once, it could take “a while” to fulfill the whole request and you could, depending on a multitude of other conditions, experience high response times.
Comparing the two above examples above, we could imagine how drastically different the performance could be. In the second example, your throughput will probably be higher. However, depending on the workload of the array at the time, you can saturate the links much easier and your server can even become a Slow Drain Device. If the HBA’s were only 2Gb or 4Gb capable, the request could outstrip the ability of the incoming bandwidth (4 200MB/sec cards = 800MB or 4 400MB/sec cards = 1,600MB respectively.)
Flash and IO Size
We often run into situations where flash arrays are recommended to improve performance and throughput. But some large IO requests in certain configurations, spinning disk can still outperform flash. This is where the Virtual Wisdom platform can help you tune a workload to work best with your chosen storage configuration with empirical evidence.
IO size higher than expected.
VirtualWisdom allows you to see IO Size trends and distribution using Histograms. You can find that information on many pre-defined reports on your portal.
What if your IO Size is higher than you expect it to be:
- check if any backups are running
- check if change tracking is enabled if the amount of data read during the backup is much higher than what it was actually backed up
- check if any full table scans are running (bad query, dropped index)
- check with database/application team if there were any changes that can explain it
What are your experiences with IO and IOPS challenges in your storage infrastructure?
Thanks!!