This is a quick writeup to visualize how VirtualWisdom SAN performance probes capture response times on Reads and Writes. We will also show how we are able to discern array latency v.s. end-to-end latency. This is a true advantage since you most likely care more about end-to-end response time than just array latency. With this type of breakdown you will be able to instantly tell if the latency is coming from the array, or from the storage network or host.
Read Timing
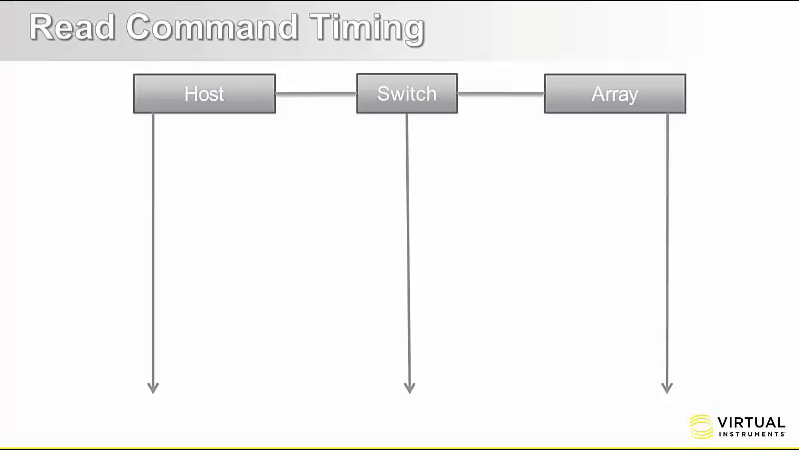
- Initiator Sends READ Command - Timers for Exchange Completion Time and Array Latency start when requests pass through the TAP.
- Target Sends data to Initiator - Array Latency Timer stops when first data frame passes through the TAP. Please Note: the reason we stop the timer here, is because an array will not start sending data back to the host until the entire read is loaded into cache.
- Target sends Status back to Initiator - Exchange Completion Time Timer stops when status passes through the TAP
Write Timing
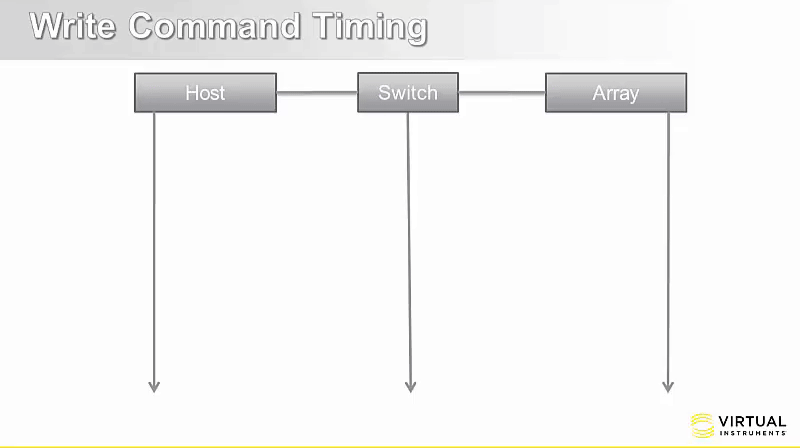
- Initiator Sends Write Command - Timers for Exchange Completion Time, Array Latency and Write Acknowledgement Latency (Cmd to TxRdy) start when requests pass through the TAP.
- Target Sends TxRdy back to Initiator - Write Acknowledgement Latency Timer stops, Array Latency Timer Stops (or Pauses depending on the request size) (Please Note: that the array will not send an acknowledgement back to the host until there is enough write cache to accept the entire write), Host Latency Timer Starts
- Initiator sends Data to Target - Host Latency Timer Stops ( or Pauses depending on the request size) and Array Latency Timer resumes after 4th Data Frame is received (optional for bigger requests)
- Same as #2 - only in case of bigger requests
- Same as #3 - only in case of bigger requests
- Target sends Status back to Initiator - Exchange Completion Time Timer stops when status passes through the TAP